This theory is developed by J. Welles Wilder Jr.
Just like stochastic, relative strength index is also a leading momentum indicator. It follows the speed of The trend & not stock price,hence it is a momentum indicator.
As momentum changes direction before price change, hence it has ability to predict trend reversal .Due to it's ability to predict it is also called leading indicator.
It is used to identify the technical strength or weakness of a particular stock.
The strength or weakness of a trend is calculated over a predetermined period of time ,called look - back period.
The basic principle behind the theory is that, when stock is in an uptrend, the prices will close near the high price & if the stock is in downtrend, the prices will close towards the low price .
The standard period to calculate RSI is 14 - day period .
Still, 5-day RSI, 7-day RSI, 10-day RSI is followed by many intraday traders.
Short look-back period creates whipsaws & may create wrong entry & exit signals, hence 14- day RSI should be used, may be for intraday or swing trading.
Depending upon overbought & oversold conditions RSI generates buy & sell signals, entry & exit.
How to calculate RSI -
The formula to calculate RSI is
RSI= 100 - (1/1+RS)
Where RS = Average gain / Average loss
Average gain = sum of gains over last 14-periods ( in simple words, addition of close prices of white(green) candles) /14
Average loss = sum of losses over last 14-periods ( in simple words addition of close prices of black(red) candles / 14
The each next value of RSI is calculated by following formula,
The next Average gain =( previous average gain)*13+current gain /14
The next average loss =( previous average loss)*13+current loss /14
The chart so formed is called RSI chart.
The value of RSI varies between 0 - 100.
If RSI value is lower than 30 it is called oversold condition .
If RSI value becomes higher than 70,it is called overbought condition.
RSI is most suited for range-bound markets, that is side-ways markets, where stock price oscillates between a certain range over a period of time.
When a stock is in strong uptrend, the RSI value may continue above 70-level over a certain period of time ,similarly when stock is in strong downtrend, the RSI value may continue below 30-level over a certain period of time.
In a strong uptrend, RSI remains in 40-90 range taking support at 40-50 level,
Similarly, in strong downtrend, RSI remains in the range10-60 with resistance at 50-60 levels.
These values may change from stock to stock.
Divergences -
Divergences occurs when, whatever chart is made by stock price is not followed or agreed by RSI.
There are two types of divergences,
1. Bullish divergence -
When in a downtrend, stock price makes lower low's,but at the same time RSI makes higher low's or steady low's,then bullish divergence is said to occur.

It indicates the stock price is decreasing but the momentum is increasing ( or keeping steady ).
As momentum changes direction before price, it predicts bullish trend reversal that is uptrend is going to start soon.
2.Bearish divergence -
When in an uptrend, stock price makes higher highs, but at the same time, RSI makes lower low's,it is called bearish divergence.

It indicates stock price is increasing, but momentum is decreasing (or keeping steady) predicting bearish trend reversal, that is,downtrend is going to start soon.
Divergences are seen in strong uptrends & downtrends.
After making high in bulltrend(uptrend) or low in beartrend(downtrend),correction has to occur & after correction trend continues again.
If we can judge corrections by RSI divergence, we can trade for certain time & capture the ongoing trend.
Opposite to bullish & bearish divergences, positive & negative reversal patterns are developed .
Positive reversal pattern -
In this pattern stock makes higher low's but RSI makes lower low's .
Negative reversal pattern-
In this pattern, stock makes lower highs but RSI makes higher highs.
Swing failure -
These types of patterns are formed when RSI reaches successively two times at the same level & reverses the direction.
There are two types of swing failures,
1.Bullish swing failure -
In this pattern, RSI moves below 30-level, comes above, reverses again & touches 30-level & then moves to overbought level.

It is also called double bottom.
2.Bearish swing failure -
In this pattern RSI moves above 70-level, comes below 70-level, then reverses back to 70-level & then moves to oversold level.

It is also called double top.
Both the phenomenon are used for swing trading.
Still RSI for different periods are calculated & intersections are used for trading. eg. 7-day RSI & 14-day RSI.
RSI is more suitable for swing tradings than intraday. Before swing trading with RSI, ample examples must be observed, studied & then should be experimented on your hard earned money .
We will study some examples when we study swing trading.
Just like stochastic, relative strength index is also a leading momentum indicator. It follows the speed of The trend & not stock price,hence it is a momentum indicator.
As momentum changes direction before price change, hence it has ability to predict trend reversal .Due to it's ability to predict it is also called leading indicator.
It is used to identify the technical strength or weakness of a particular stock.
The strength or weakness of a trend is calculated over a predetermined period of time ,called look - back period.
The basic principle behind the theory is that, when stock is in an uptrend, the prices will close near the high price & if the stock is in downtrend, the prices will close towards the low price .
The standard period to calculate RSI is 14 - day period .
Still, 5-day RSI, 7-day RSI, 10-day RSI is followed by many intraday traders.
Short look-back period creates whipsaws & may create wrong entry & exit signals, hence 14- day RSI should be used, may be for intraday or swing trading.
Depending upon overbought & oversold conditions RSI generates buy & sell signals, entry & exit.
How to calculate RSI -
The formula to calculate RSI is
RSI= 100 - (1/1+RS)
Where RS = Average gain / Average loss
Average gain = sum of gains over last 14-periods ( in simple words, addition of close prices of white(green) candles) /14
Average loss = sum of losses over last 14-periods ( in simple words addition of close prices of black(red) candles / 14
The each next value of RSI is calculated by following formula,
The next Average gain =( previous average gain)*13+current gain /14
The next average loss =( previous average loss)*13+current loss /14
The chart so formed is called RSI chart.

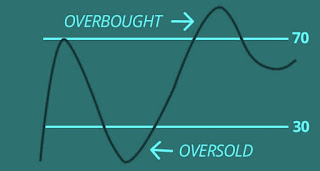
Basic chart of RSI
If RSI value is lower than 30 it is called oversold condition .
If RSI value becomes higher than 70,it is called overbought condition.
RSI is most suited for range-bound markets, that is side-ways markets, where stock price oscillates between a certain range over a period of time.
When a stock is in strong uptrend, the RSI value may continue above 70-level over a certain period of time ,similarly when stock is in strong downtrend, the RSI value may continue below 30-level over a certain period of time.
In a strong uptrend, RSI remains in 40-90 range taking support at 40-50 level,
Similarly, in strong downtrend, RSI remains in the range10-60 with resistance at 50-60 levels.
These values may change from stock to stock.
Divergences -
Divergences occurs when, whatever chart is made by stock price is not followed or agreed by RSI.
There are two types of divergences,
1. Bullish divergence -
When in a downtrend, stock price makes lower low's,but at the same time RSI makes higher low's or steady low's,then bullish divergence is said to occur.
Bullish divergence (initially stock
price making crests in downward
direction but RSI making crest in
upward direction.)
As momentum changes direction before price, it predicts bullish trend reversal that is uptrend is going to start soon.
2.Bearish divergence -
When in an uptrend, stock price makes higher highs, but at the same time, RSI makes lower low's,it is called bearish divergence.
Bearish divergence(stock price making
Peaks in upward direction while RSI making crest in downward direction.)
Divergences are seen in strong uptrends & downtrends.
After making high in bulltrend(uptrend) or low in beartrend(downtrend),correction has to occur & after correction trend continues again.
If we can judge corrections by RSI divergence, we can trade for certain time & capture the ongoing trend.
Opposite to bullish & bearish divergences, positive & negative reversal patterns are developed .
Positive reversal pattern -
In this pattern stock makes higher low's but RSI makes lower low's .
Negative reversal pattern-
In this pattern, stock makes lower highs but RSI makes higher highs.
Swing failure -
These types of patterns are formed when RSI reaches successively two times at the same level & reverses the direction.
There are two types of swing failures,
1.Bullish swing failure -
In this pattern, RSI moves below 30-level, comes above, reverses again & touches 30-level & then moves to overbought level.
Bullish swing failure.
2.Bearish swing failure -
In this pattern RSI moves above 70-level, comes below 70-level, then reverses back to 70-level & then moves to oversold level.
Bearish swing failure.
Both the phenomenon are used for swing trading.
Still RSI for different periods are calculated & intersections are used for trading. eg. 7-day RSI & 14-day RSI.
RSI is more suitable for swing tradings than intraday. Before swing trading with RSI, ample examples must be observed, studied & then should be experimented on your hard earned money .
We will study some examples when we study swing trading.
No comments:
Post a Comment