Gravestone doji coupled with stochastic -
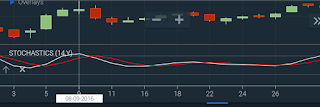

The above chart shows gravestone doji at vertical line in price chart. The graph is of Apollo tyre sep-2016.
At the vertical line signal line is touching 80-level & stochastic line is near to 80-level(overbought level). If you see left to vertical line a small uptrend occurred & then gravestone doji appeared just slightly before stochastic becomes overbought. See the next candle to vertical line & it is prominent red. It proves,at overbought region gravestone doji appeared as trendchanger candle.
Hammer coupled with stochastic -


In the above figure initially a small downtrend occurred & stochastic coming from overbought region to oversold region. Just near oversold level, signal line & stochastic line intersect each other. At the same time hammer appeared in the price chart. See the vertical line. If you observe the candle next to vertical line, it is prominently bullish.
If you look left to vertical line in price chart a white spining top appeared & then hammer appeared confirming bullish trend & yielding approximately 5% gain in a single day.
Hanging man coupled with stochastic

The above chart of State bank of India Apr-2015 shows hanging man in price chart.
Before that stochastic came from oversold to overbought level in few candles. When signal line crosses 80-level,hanging man appeared. Stochastic line is near to 80-level.At this stage hanging man predicts the next candle should be red.
If you look left in the chart the stochastic is in overbought level. If you see in price chart candles have small body & smaller tails. This is the indication that the stock is sideways.
If you look to the right end, when stochastic is oversold marubozu candle is seen. It's open is above the previous close & at the same time stochastic & signal line are intersecting. This indicates next candle should be green.
Marubozu coupled with stochastic -

Ideally marubozu has no tails on either end but practically it may have small tails.
Marubozu may be red or green & may appear at both the ends as trend-changer.Marubozu represents buying or selling only from one side means opponents are waiting for trend change.
If you look at the above chart of Hindustan Unilever Aug-2019,red marubozu is occurring perfectly at the time when stochastic is overbought & signal line & stochastic line are interesting. The next candle is small but red again.
If you look to the left in the chart dragonfly doji appeared near oversold region. Remember doji may not show sudden change. It indicates the ongoing trend (downtrend) is coming to end soon. The next candle again red marubozu & stochastic at 20 confirms next candle should be green & same is the case.
At the right end of the chart again green marubozu after two small red marubozu signals the next candle should be green, when stochastic is oversold. Before that stochastic remained in oversold region for many candles & each candle is red.
 The above graph is perfect representation of marubozu as a trend-changer.This graph is of ICICI bank Aug-2020.
If we view to the left of vertical line a downtrend is occurring & stochastic is falling from overbought to oversold condition. When just signal line running below the stochastic line touches 20-level & at the same time intersecting with stochastic line, firm green marubozu occurs. It indicates trend has changed & the next candle is green.
If you view the right side to vertical line again it's prominent green marubozu occurring when stochastic is just above 20-level & signal line overlapping. The next candle is green again.
Interpretation-
Candlestick may act as trend-changer candlestick under certain conditions & that condition may be overbought & oversold. You may add volume at that particular time & take decisions.
To trade intraday, it is suggested to select the stock freshly entering into oversold or overbought condition. At this particular stage or near about these conditions, if trend changer candle appears the next candle may reverse of the preceding trend.
If the candle body is small & tails are short at these levels, the stock might go into sideways. So trading in such a situation should be avoided.
It is a matter of common sense to verify the candle. Ideally what we learn doesn't happen practically all the time. Candles having tails on both the sides equal to or bit less than the body may be treated as spining top. Marubozu may have small tail on one side or both. Hammer & inverted hammer may have little tail on the opposite side.
Well friends,how many stocks you have in your watchlist?
I have at least 50 stock in my watchlist. Make watchlist at least of 20-30 stocks, depending upon your daily leisure time. If you have PC it's better. On cellphone you may get stock price chart & below this select whichever indicator you want. Your broker provides this facility on his app.
Select a stock, select any indicator you prefer & watch oversold & overbought condition. See whether stock is freshly entering into these regions with trend-changer candlestick. Repeat this till you get the stock satisfying these conditions. You won't require more than one hour to do this to get one stock a day.
So friends, what should be the strategy for intraday.?
Intraday strategy-
a. If the stock enters freshly in overbought condition & trend-changer candle appears then
1.sell pre-open for the next day. Pre-open means before market opens next day.
2.Buy the stock before market closes the next day.
b. If the stock freshly enters oversold condition & trend-changer candle appears then
1.Buy pre-open for the next day, before market opening the next day.
2.Sell the stock before the market closes the next day.
Less requirement that stop-loss loss is needed.
This is the rough idea I am putting forward.You may improve if you want.
So friends, how do you feel about my idea? Write to me on my email.
Hanging man coupled with stochastic

The above chart of State bank of India Apr-2015 shows hanging man in price chart.
Before that stochastic came from oversold to overbought level in few candles. When signal line crosses 80-level,hanging man appeared. Stochastic line is near to 80-level.At this stage hanging man predicts the next candle should be red.
If you look left in the chart the stochastic is in overbought level. If you see in price chart candles have small body & smaller tails. This is the indication that the stock is sideways.
If you look to the right end, when stochastic is oversold marubozu candle is seen. It's open is above the previous close & at the same time stochastic & signal line are intersecting. This indicates next candle should be green.
Marubozu coupled with stochastic -

Ideally marubozu has no tails on either end but practically it may have small tails.
Marubozu may be red or green & may appear at both the ends as trend-changer.Marubozu represents buying or selling only from one side means opponents are waiting for trend change.
If you look at the above chart of Hindustan Unilever Aug-2019,red marubozu is occurring perfectly at the time when stochastic is overbought & signal line & stochastic line are interesting. The next candle is small but red again.
If you look to the left in the chart dragonfly doji appeared near oversold region. Remember doji may not show sudden change. It indicates the ongoing trend (downtrend) is coming to end soon. The next candle again red marubozu & stochastic at 20 confirms next candle should be green & same is the case.
At the right end of the chart again green marubozu after two small red marubozu signals the next candle should be green, when stochastic is oversold. Before that stochastic remained in oversold region for many candles & each candle is red.

If we view to the left of vertical line a downtrend is occurring & stochastic is falling from overbought to oversold condition. When just signal line running below the stochastic line touches 20-level & at the same time intersecting with stochastic line, firm green marubozu occurs. It indicates trend has changed & the next candle is green.
If you view the right side to vertical line again it's prominent green marubozu occurring when stochastic is just above 20-level & signal line overlapping. The next candle is green again.
Interpretation-
Candlestick may act as trend-changer candlestick under certain conditions & that condition may be overbought & oversold. You may add volume at that particular time & take decisions.
To trade intraday, it is suggested to select the stock freshly entering into oversold or overbought condition. At this particular stage or near about these conditions, if trend changer candle appears the next candle may reverse of the preceding trend.
If the candle body is small & tails are short at these levels, the stock might go into sideways. So trading in such a situation should be avoided.
It is a matter of common sense to verify the candle. Ideally what we learn doesn't happen practically all the time. Candles having tails on both the sides equal to or bit less than the body may be treated as spining top. Marubozu may have small tail on one side or both. Hammer & inverted hammer may have little tail on the opposite side.
Well friends,how many stocks you have in your watchlist?
I have at least 50 stock in my watchlist. Make watchlist at least of 20-30 stocks, depending upon your daily leisure time. If you have PC it's better. On cellphone you may get stock price chart & below this select whichever indicator you want. Your broker provides this facility on his app.
Select a stock, select any indicator you prefer & watch oversold & overbought condition. See whether stock is freshly entering into these regions with trend-changer candlestick. Repeat this till you get the stock satisfying these conditions. You won't require more than one hour to do this to get one stock a day.
So friends, what should be the strategy for intraday.?
Intraday strategy-
a. If the stock enters freshly in overbought condition & trend-changer candle appears then
1.sell pre-open for the next day. Pre-open means before market opens next day.
2.Buy the stock before market closes the next day.
b. If the stock freshly enters oversold condition & trend-changer candle appears then
1.Buy pre-open for the next day, before market opening the next day.
2.Sell the stock before the market closes the next day.
Less requirement that stop-loss loss is needed.
This is the rough idea I am putting forward.You may improve if you want.
So friends, how do you feel about my idea? Write to me on my email.
No comments:
Post a Comment