There are so many trading techniques developed depending upon which indicator trader uses for trading.
Crossover methods -
In this method, simple moving average(SMA) or exponential moving average(EMA) crossover methods are used.
Simple moving average is calculated for a stock under observation for two different time frames, (say 20-day SMA & 50-day SMA) on the stock price chart & intersection of these two lines are treated as buy & sell signals.
When SMA line of short duration (in this case 20-day SMA line) crosses & proceeds above the longer duration SMA line(in this case 50-day SMA line),it is treated as buy signal.
If short period SMA line crosses longer period SMA line from above & drops below it, then it is treated as sell signal.
Same is the procedure for EMA crossover.
The time periods should be adjusted according to traders requirements.
These methods are not suitable for intraday & sideways markets. If market is in strong uptrend or downtrend these methods can be relied upon.
Actually these methods are used to identify the trend & not for actual trading.
Use of indicators -
Over the years, many indicators are developed(studied earlier) for trading purposes. These are categorised as leading & lagging indicators.
Leading indicators ( stochastic & RSI) are traded keeping in mind oversold & overbought conditions. If the indicator is oversold(value is 20 or below), it is treated as buy signal & if the indicator is overbought (value is 80 or above) it is treated as sell signal.
Leading indicators are useful in sideways markets that is stock price is moving between a particular price range called support & resistance level.
If the stock is in strong uptrend or downtrend, the indicator remains in overbought or oversold condition for a prolonged time makes it difficult to trade that particular stock.
To avoid this,two graphs of same indicator(stochastic or rsi) but for different time period (may be 7-day & 14-day or 14-day & 26-day)are taken for a single stock price chart & intersection of these two lines are treated as buy & sell signals.
If a short term indicator line crosses a long term indicator line from below & proceeds upward it is treated as buy signal & vice versa.
Some traders couple more than one indicators to gauge entry & exit for single stock price chart.
But if we couple so many indicators it creates many whipsaws & confusion resulting losses in trade.
So it is always advised to couple 2 indicators at a time, at the most 3.Trader may use one indicator for entry & other for exit or you may take entry & exit considering the behaviour of both the indicators at a time.
In all these trading methods candlestick & candlestick patterns are less observed & given weightage to.
So my all theory solely revolve around to couple candlestick or candlestick patterns with a single indicator & find trading opportunities for intraday & swing trading.
Trend-changer candlesticks -
Single candle represents the behaviour of market & traders, the candle may be minute candle, hourly, daily or weekly. Single candle describe the past & if studied properly it also predict future. Not all but many next candles can be predicted if you observe so many charts carefully.
Spining top -

In this candle the body is small & tails are longer.
It shows traders indecision about the particular price.Buyers pull the price upward & sellers drag it below, resulting in longer tails & short body.
These candles frequently appear as trend-changer candlestick.
Inverted hammer & shooting star -

Ideally these candles show tail at upper end & small body.
It indicates selling pressure that is selling is more than buying.
Gravestone doji & dragonrfly doji -
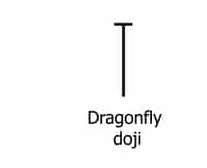

These candles have longer upper or lower tails & no tail on other side & ideally have no body. These also shows indecision in the market.
Hammer & hanging man -

These candles having lower tails longer & ideally no upper tail & small body.
Lesser times these act as trendchanger candlestick.
Marubozu -

 Ideally these have no upper or lower tails.
All these candles can act as trend-changer candlesticks under certain conditions. Let's find these conditions by coupling these candles with modern indicators.
Why these candles act as trend-changer candlesticks?
All these candles have small body & long tails. Long tails indicates more buying or selling pressure which may result in trend change. When both the tails are long it also indicates indecision in market, hence may result in trend-change.
So let's couple these candles with single indicator & see the trading opportunities from next lesson.
Crossover methods -
In this method, simple moving average(SMA) or exponential moving average(EMA) crossover methods are used.
Simple moving average is calculated for a stock under observation for two different time frames, (say 20-day SMA & 50-day SMA) on the stock price chart & intersection of these two lines are treated as buy & sell signals.
When SMA line of short duration (in this case 20-day SMA line) crosses & proceeds above the longer duration SMA line(in this case 50-day SMA line),it is treated as buy signal.
If short period SMA line crosses longer period SMA line from above & drops below it, then it is treated as sell signal.
Same is the procedure for EMA crossover.
The time periods should be adjusted according to traders requirements.
These methods are not suitable for intraday & sideways markets. If market is in strong uptrend or downtrend these methods can be relied upon.
Actually these methods are used to identify the trend & not for actual trading.
Use of indicators -
Over the years, many indicators are developed(studied earlier) for trading purposes. These are categorised as leading & lagging indicators.
Leading indicators ( stochastic & RSI) are traded keeping in mind oversold & overbought conditions. If the indicator is oversold(value is 20 or below), it is treated as buy signal & if the indicator is overbought (value is 80 or above) it is treated as sell signal.
Leading indicators are useful in sideways markets that is stock price is moving between a particular price range called support & resistance level.
If the stock is in strong uptrend or downtrend, the indicator remains in overbought or oversold condition for a prolonged time makes it difficult to trade that particular stock.
To avoid this,two graphs of same indicator(stochastic or rsi) but for different time period (may be 7-day & 14-day or 14-day & 26-day)are taken for a single stock price chart & intersection of these two lines are treated as buy & sell signals.
If a short term indicator line crosses a long term indicator line from below & proceeds upward it is treated as buy signal & vice versa.
Some traders couple more than one indicators to gauge entry & exit for single stock price chart.
But if we couple so many indicators it creates many whipsaws & confusion resulting losses in trade.
So it is always advised to couple 2 indicators at a time, at the most 3.Trader may use one indicator for entry & other for exit or you may take entry & exit considering the behaviour of both the indicators at a time.
In all these trading methods candlestick & candlestick patterns are less observed & given weightage to.
So my all theory solely revolve around to couple candlestick or candlestick patterns with a single indicator & find trading opportunities for intraday & swing trading.
Trend-changer candlesticks -
Single candle represents the behaviour of market & traders, the candle may be minute candle, hourly, daily or weekly. Single candle describe the past & if studied properly it also predict future. Not all but many next candles can be predicted if you observe so many charts carefully.
Spining top -
In this candle the body is small & tails are longer.
It shows traders indecision about the particular price.Buyers pull the price upward & sellers drag it below, resulting in longer tails & short body.
These candles frequently appear as trend-changer candlestick.
Inverted hammer & shooting star -
Ideally these candles show tail at upper end & small body.
It indicates selling pressure that is selling is more than buying.
Gravestone doji & dragonrfly doji -
These candles have longer upper or lower tails & no tail on other side & ideally have no body. These also shows indecision in the market.
Hammer & hanging man -
These candles having lower tails longer & ideally no upper tail & small body.
Lesser times these act as trendchanger candlestick.
Marubozu -
All these candles can act as trend-changer candlesticks under certain conditions. Let's find these conditions by coupling these candles with modern indicators.
Why these candles act as trend-changer candlesticks?
All these candles have small body & long tails. Long tails indicates more buying or selling pressure which may result in trend change. When both the tails are long it also indicates indecision in market, hence may result in trend-change.
So let's couple these candles with single indicator & see the trading opportunities from next lesson.
Traders always want the best trading stock to make a profit in market money Capital heights always fantastic and best trading platform in tips in India.
ReplyDelete